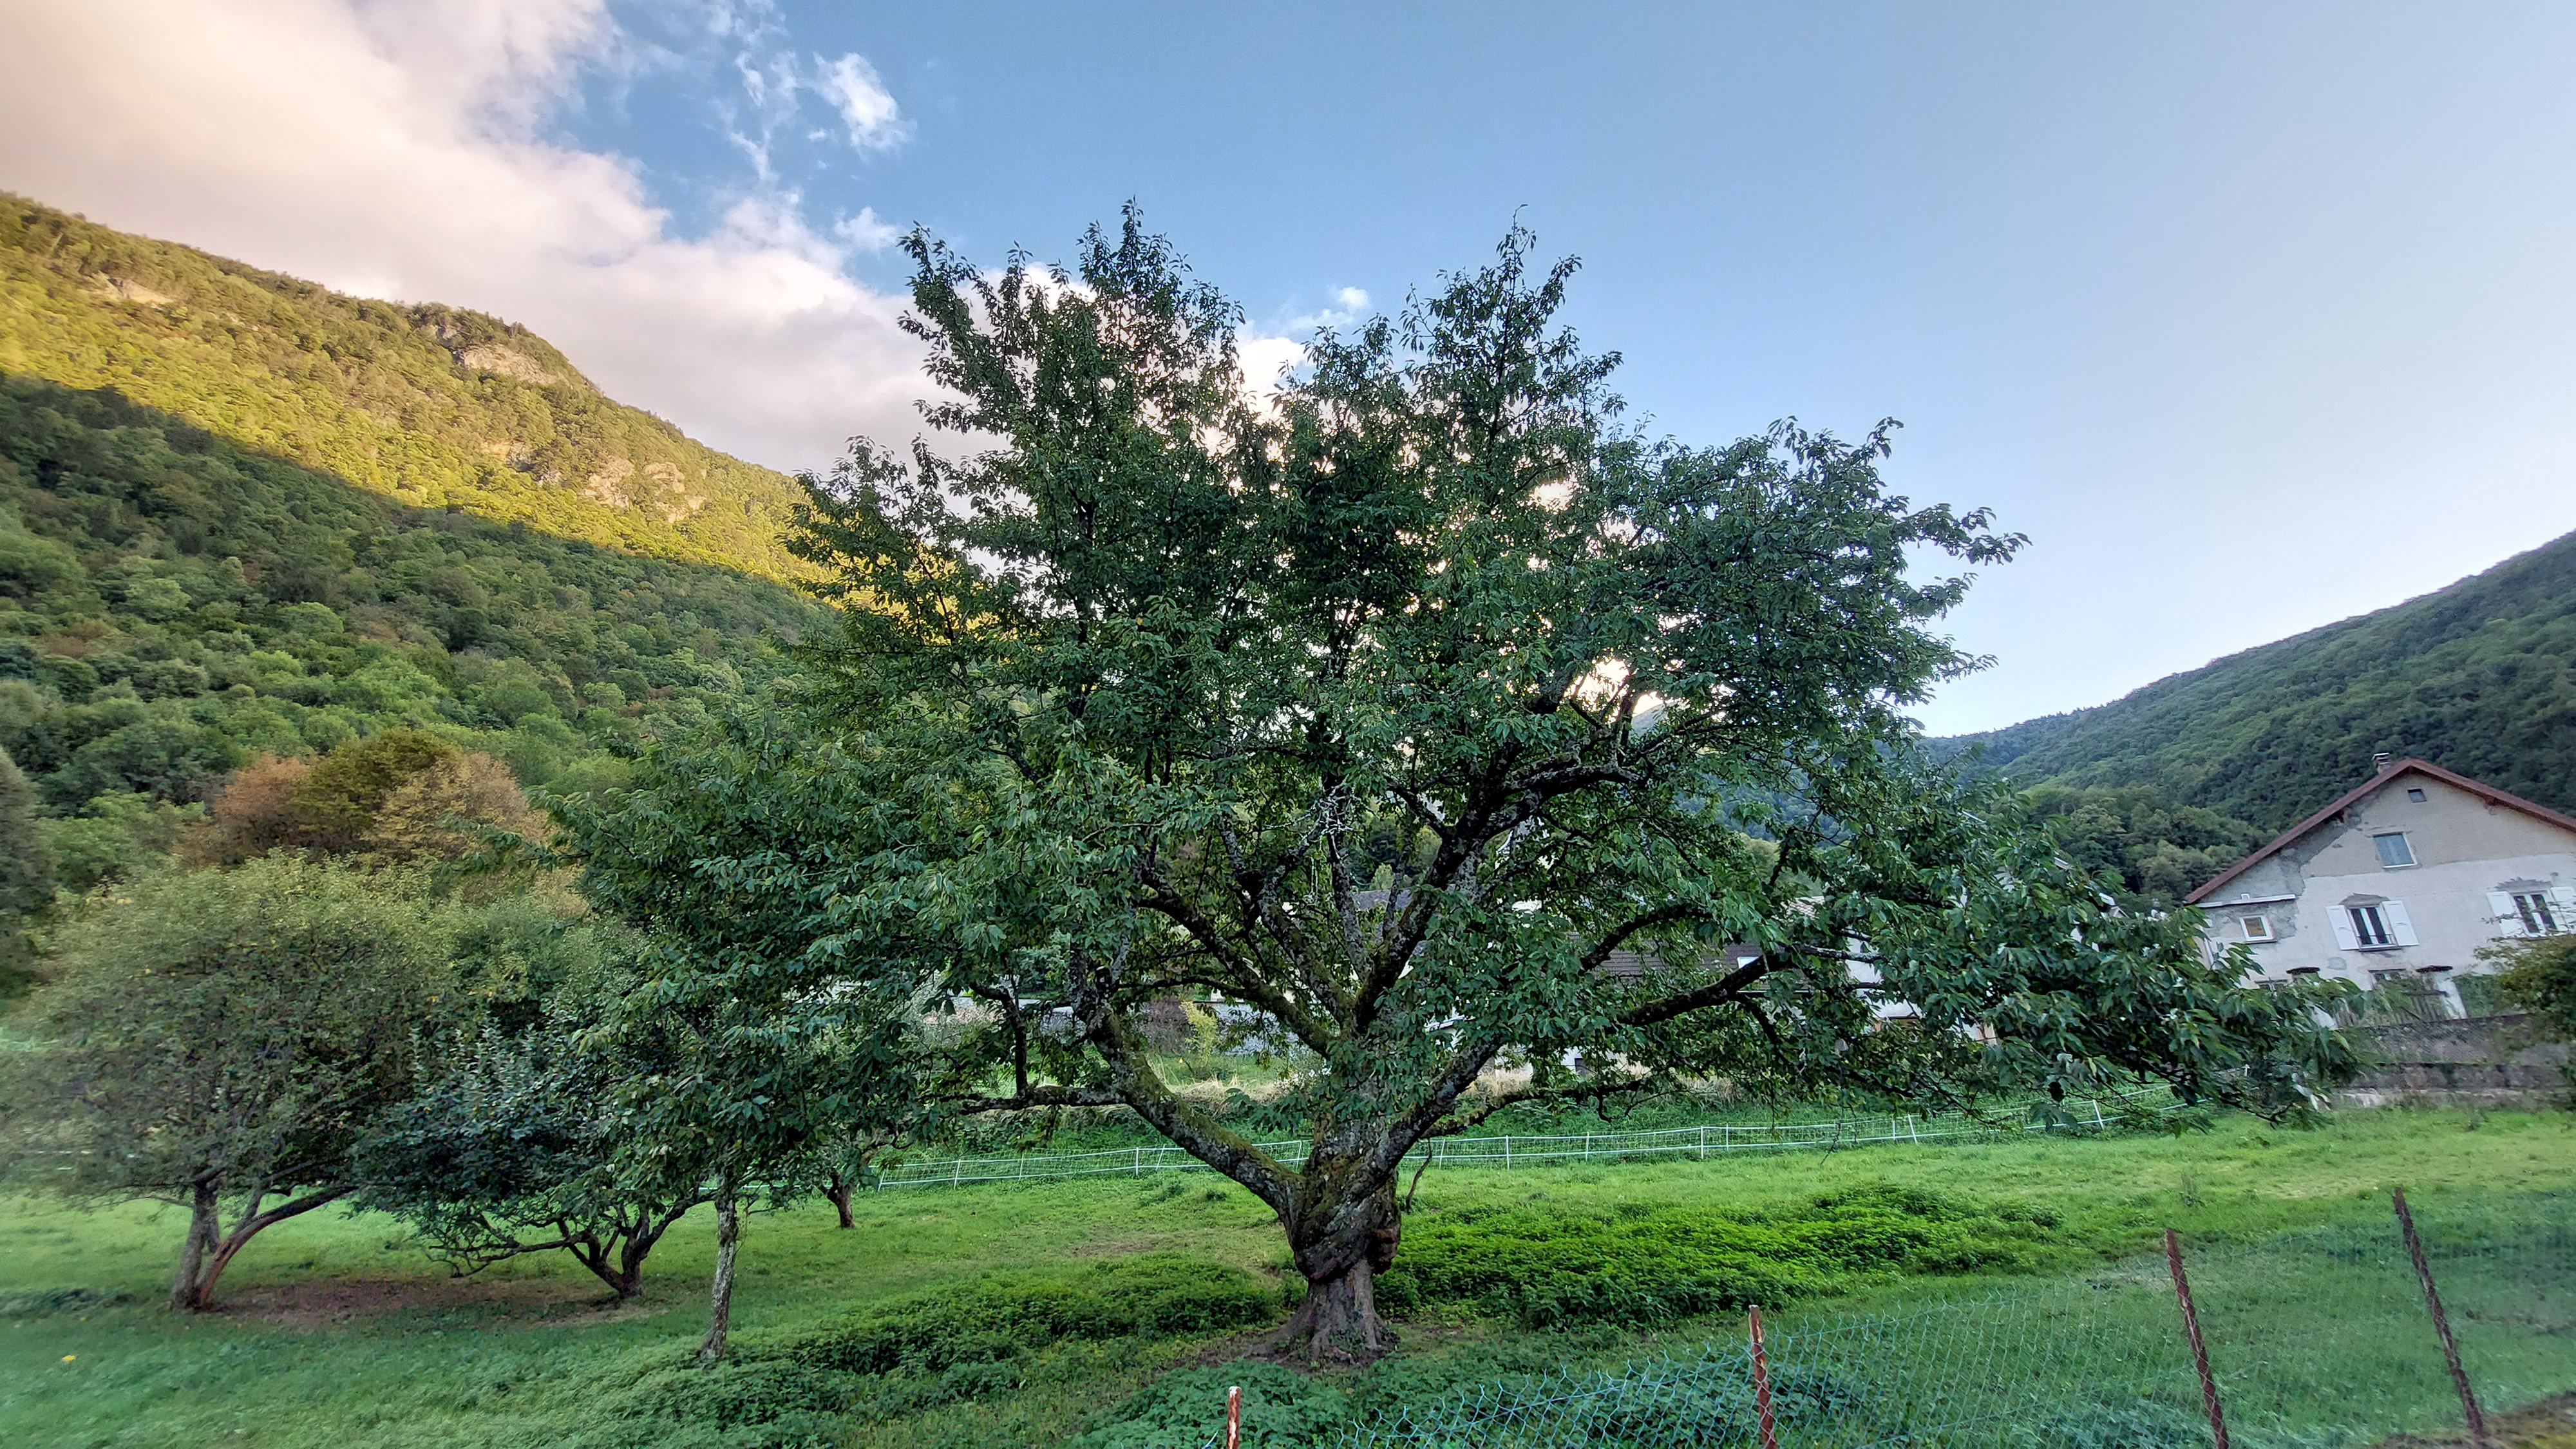
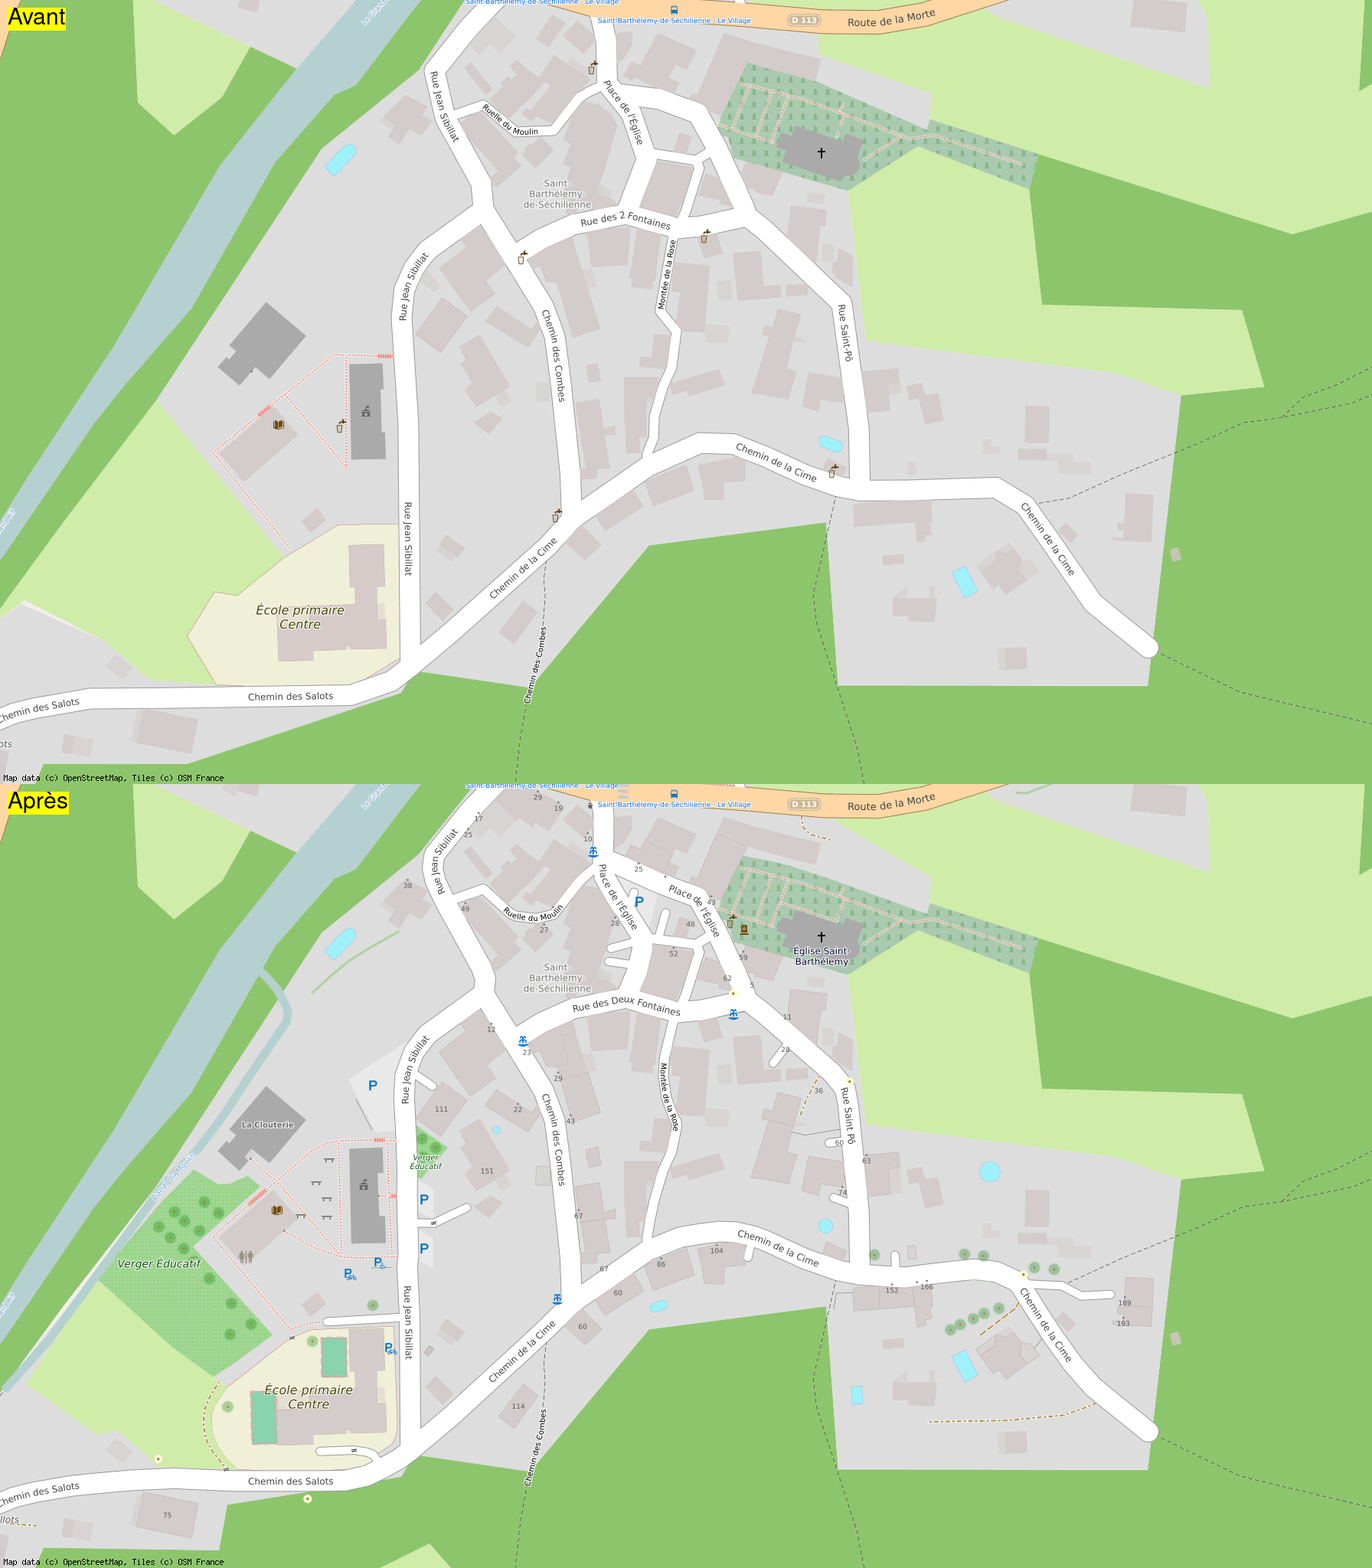
Greetings to all OSM contributors, I have finally found some time to share my mapping party report. I wrote it in English and French. This mapping party was held in France near Grenoble, in a village called Saint-Barthélemy-de-Séchilienne. There were 8 of us who participated in this mapping event.

For the report, I wrote some scripts: a bash script that uses the osmosis command to extract the following metrics like : number of roads, tracks, roads with names, alleys, shops, libraries, buildings, …, see the full list in the report.
The idea of this script was to download the data of the city/village before the mapping party and run the script on the resulting osm file. Then, do the same after the mapping party to see how many objects were added. Info about my script can be found here
I also created a custom Jekyll theme with OSM POI icons in the background to make the report look nice.
![]()
If you read the report, you saw that I added some before/after gifs. I actually made a lot more of them. And to make my life easier, I wrote two python scripts. One to download the single before and after pngs. And another one to merge the two pngs into an animated gif.

Please let me know in the comments if you have any suggestions to improve my report or if you want to share a link to your own mapping party reports.
Have a nice day
Again the links to the report: