
Here is a brief analysis of trends in OSM edits and spatial distribution using compiled statistics from Pascal Neis osmstats website. The link at the bottom of the page will let you download the csv data (by month, quarter / country, region, continent) and make your own analysis.
Thanks to Pascal who provides such usefull infos about OSM activities. As Organized editing statistics have been added to the osmstas website at the beginning of 2022, we will cover the periods from 2022-04 to to 2023-06.
Trends by type of edition
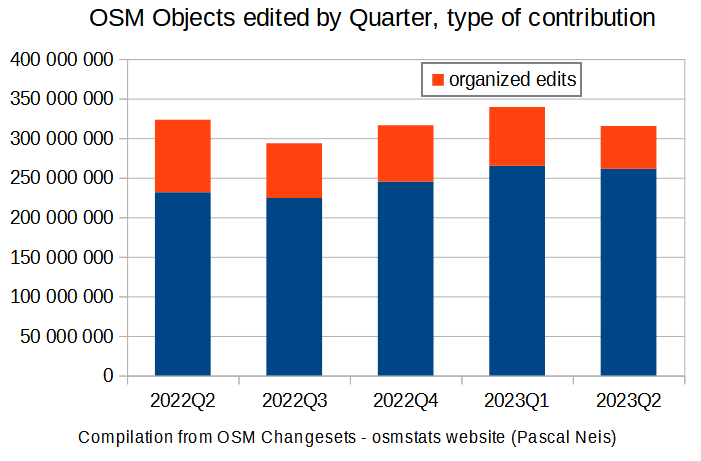
As illustrated on graph 1, there was a small decline of OSM objects edited during this period from 323 millions objects edited in 2022-Q2 to 314 millions in 2023-Q2. This decline comes from the Organized editing with 92 millions objects edited in 2022-Q2 to 54 millions in 2023-Q2 (his share from 28% to 17%).
Graph 1
Organized edits Trends by Continent
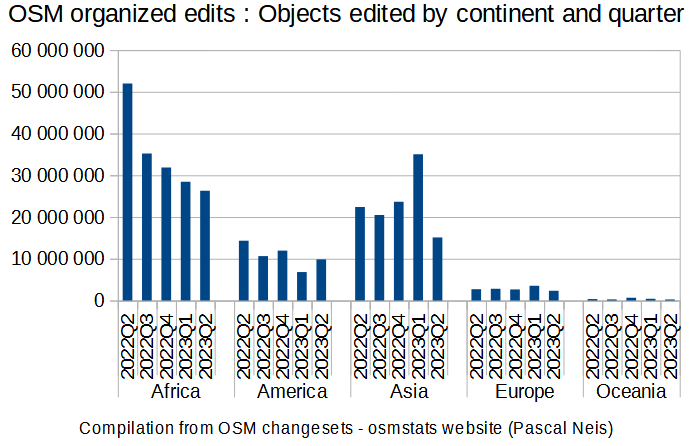
As illustrated on graph 2, Africa has a great share of Organized editing but its share decreased from 57% in 2022-Q2 to 49 % in 2023-Q2. Asia had a different trend moving from 24% in 2022-Q2 to 47% in 2023-Q1 and a sharp decline to 28% in 2023-Q2. America is the third with its share moving from 16% to 18%.
The rise of Organized editing in Asia for 2023-Q1 comes mainly from Syria (7 millions) and Turkey (12 millions) and started days after the Turkey-Syria earthquake on 6 February 2023.
Graph 2
Edit Trends by Continent - Share of organized editing
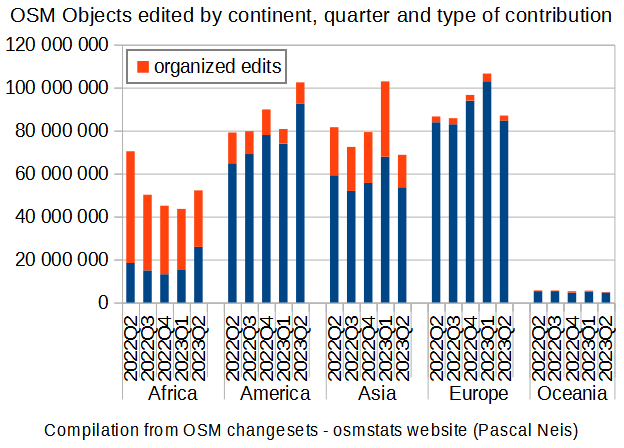
As illustrated on graph 3, Organized editing is predominent in Africa but its share of total objects edited in the continent decreased from 74% in 2022-Q2 to 52% in 2023-Q2. In Asia, the share of organized edits decreased from 28% to 22%. For all continents, this share moved from 28% in 2022-Q2 to 17% in 2023-Q2.
Graph 3
source of data : Compilation from Pascal Neis osmstats website (based on OSM Planet changesets) - Copyright © Pascal Neis - Statistics of the free wiki world map (OpenStreetMap.org) - Map data © OpenStreetMap contributors
The result of compilation can be downloaded from Github