
I haven’t done a contributor statistics diary post in a long time, but I suspect that the latest update of the graphs on the wiki is likely to lead to some questions.
As we can see in
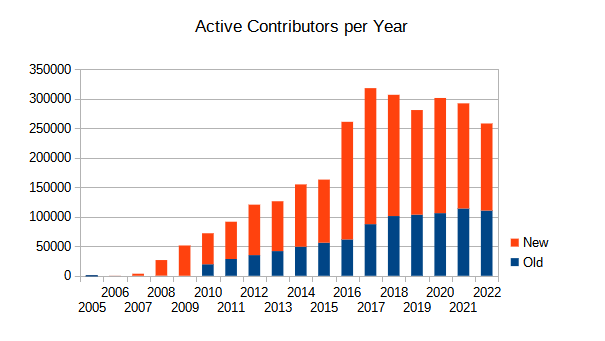
the number of new contributors to OSM has dropped quite a bit in 2022. As the overall number of contributors has always been dominated by the new contributors it isn’t a surprise that the overall number is down too.
The interesting question is if we can pinpoint any “source” of this reduction. As a 1st investigative step I gave the numbers for editing apps used by new editors a look. I’ve been producing the numbers for a long time, but have never published them previously, if we look at 2021 and 2022 we see:
| 2021 | 2022 | |
|---|---|---|
| iD | 152’572 | 119’982 |
| Maps.me + OM | 9’563 | 10’930 |
| Streetcomplete | 7’591 | 6’493 |
| JOSM | 3’128 | 3’039 |
| OsmAnd | 1’642 | 1’711 |
| Other | 3’765 | 5’492 |
| Total | 178’261 | 147’647 |
As we can see the majority of the drop is caused by a lower number of new contributors via iD, all other sources are more or less stable. This rules out causes like we have previously seen with Maps.me that are primarily due to actions by the apps marketeers.
Naturally the reduction is not a “fault” of iD, it just means less people are arriving at openstreetmap.org and making their first edit there. If there is a notable difference in sources for new mappers would need analysis on the OSMF side of things as this requires access to the website statistics. It is however likely that the effect is not going to be noticeable in the sign up numbers as these outnumber actual new contributors by far.
What we can do with just OSM data is see if there are regional effects or changes with respect to other “well known” sources that might throw some light on the matter. Currently I need to re-geocode my changeset database which will take a bit, but what I’ve always produced are numbers on HOT originating new mappers.
In 2021 there were 57’284 new mappers that had HOT related hashtags in their 1st changeset, in 2022 “only” 32’346, a drop of nearly 25’000 that would explain a lot. However this needs to viewed critically as changes in how HOT acquires new mappers and initial mapping introducing could just as well lead to this difference. It should be noted that 2020 and 2021 were “peak HOT” and that the 30k is more in line with the long term average.
I intend to update this post if there are any new insights that are relevant.
See the end of maps.me for more on how strongly the stats were effected by the decisions of a single app owner without an underlying trend pro or con OSM.