
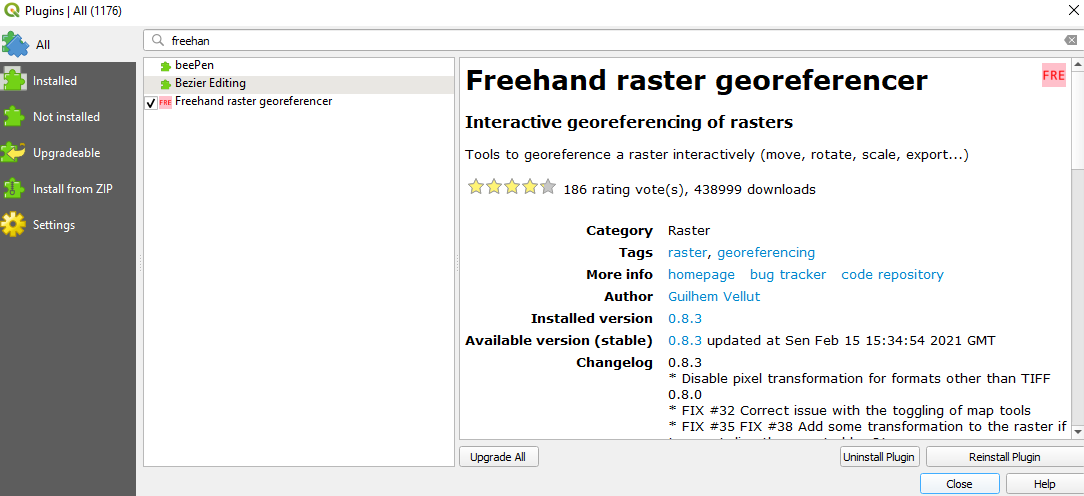
So, I stumbled upon this rain forecast map.
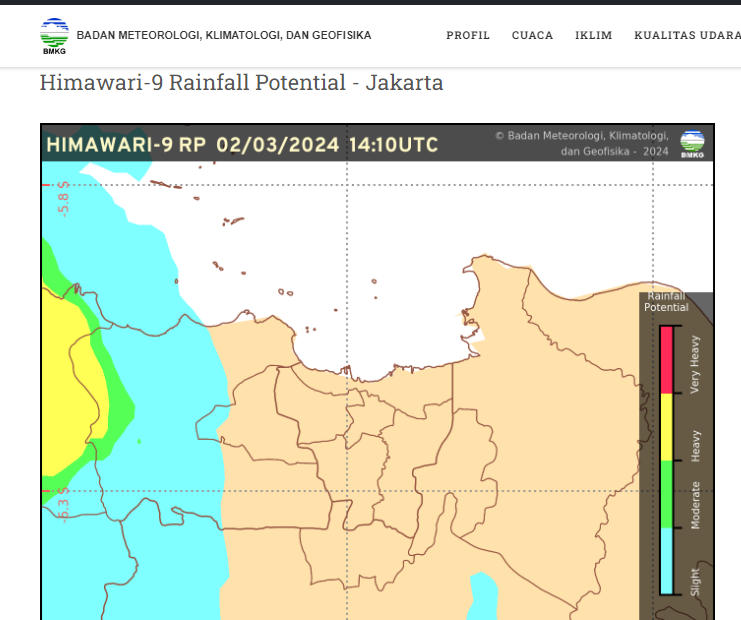
Cool. But I’m still not satisfied. I want to check the forecast situation around my house, specifically.
I have an idea. What if I overlay this image on OpenStreetMap?
Aligning
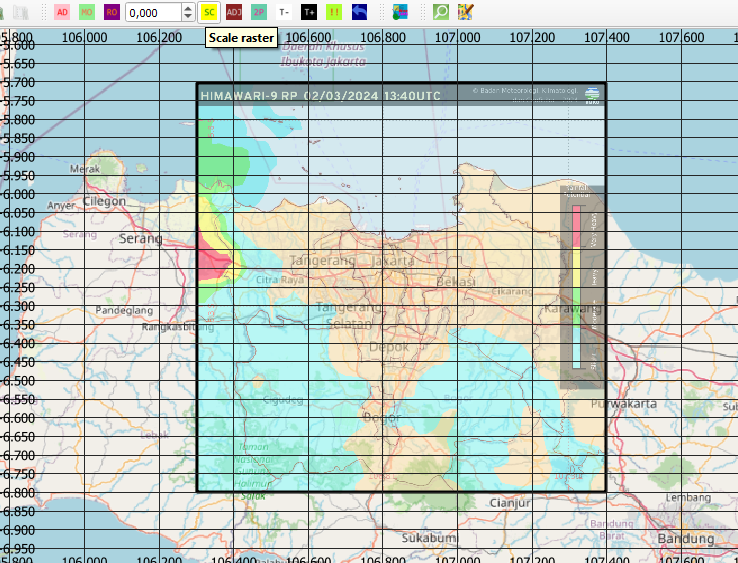
The first problem that I encountered is on how to properly align it with the OpenStreetMap map. Thankfully, this forecast map includes a coordinate grid.
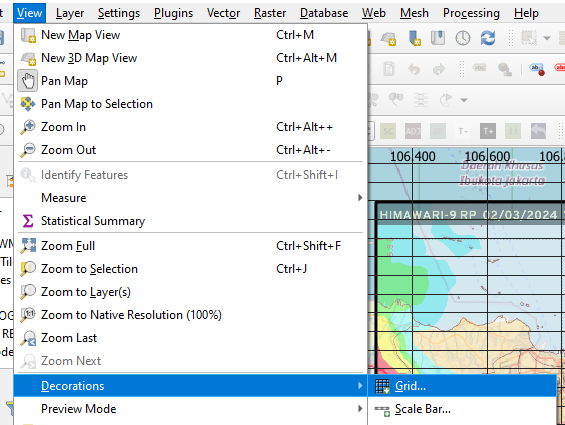
So, I can show QGIS’s coordinate grid and align it properly.
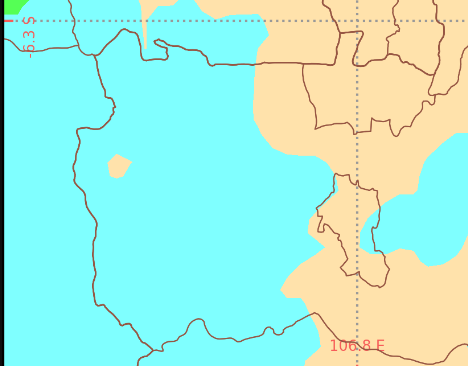
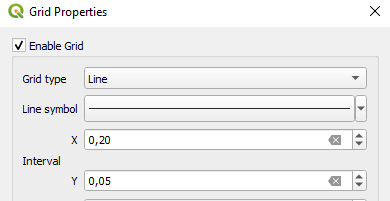
I see -5.35 on the Y grid and 106.8 on the X grid, so I set a resolution of 0.05 on the Y-axis and 0.2 on the X-axis.
Next, I have to move and scale the image manually by using freehand raster georeferencer.
Stretching
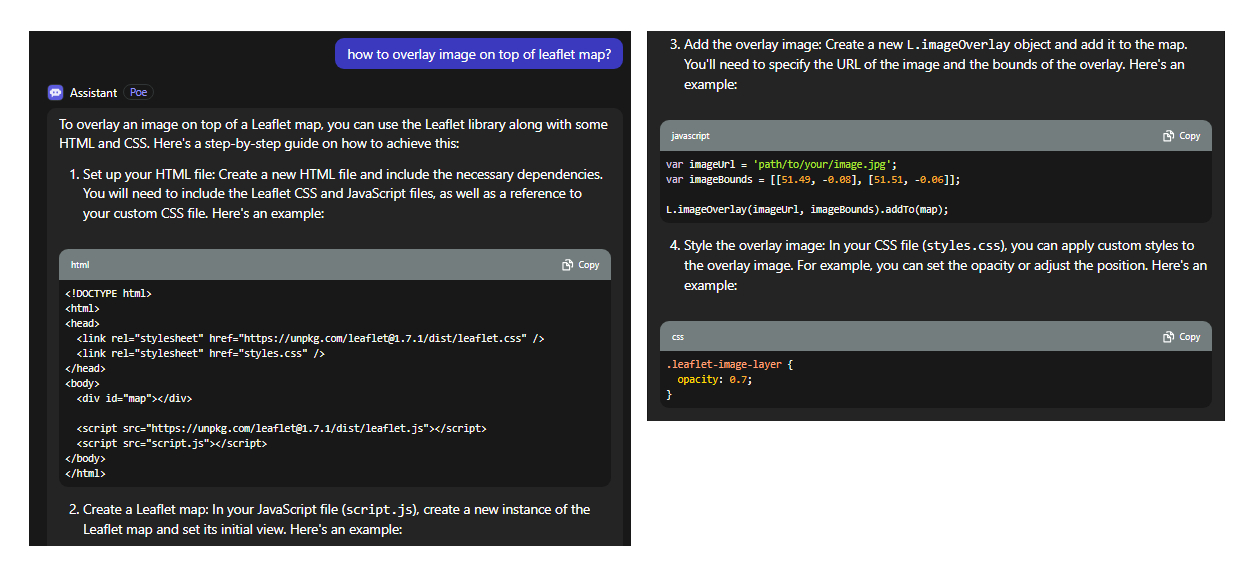
Once it’s roughly aligned, the next thing I do is check the bottom-left coordinate of the image and the top-right coordinate of the image. Leaflet can “stretch” the image based on these two reference coordinate.
But anyway, now I need some code..
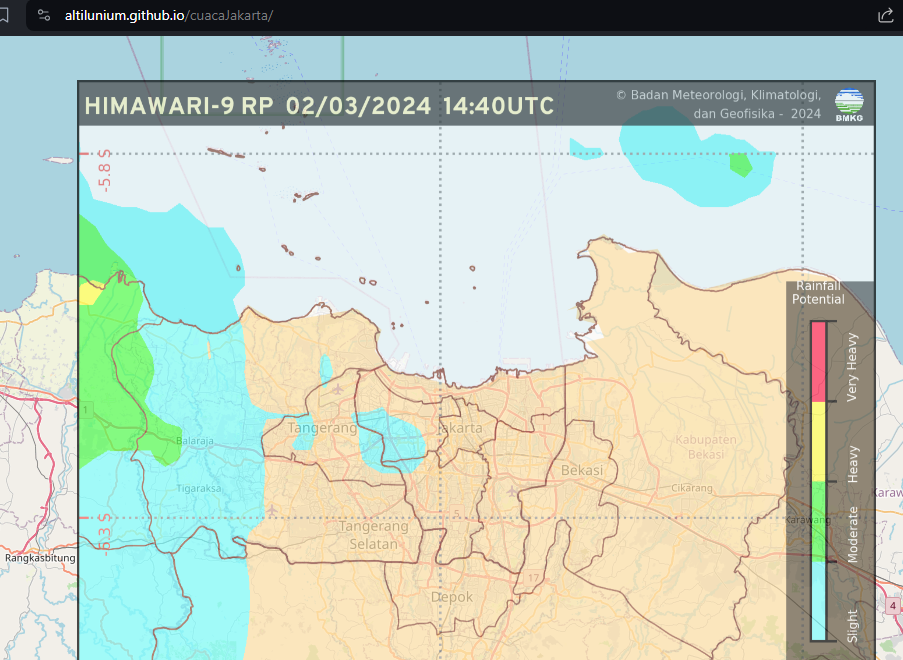
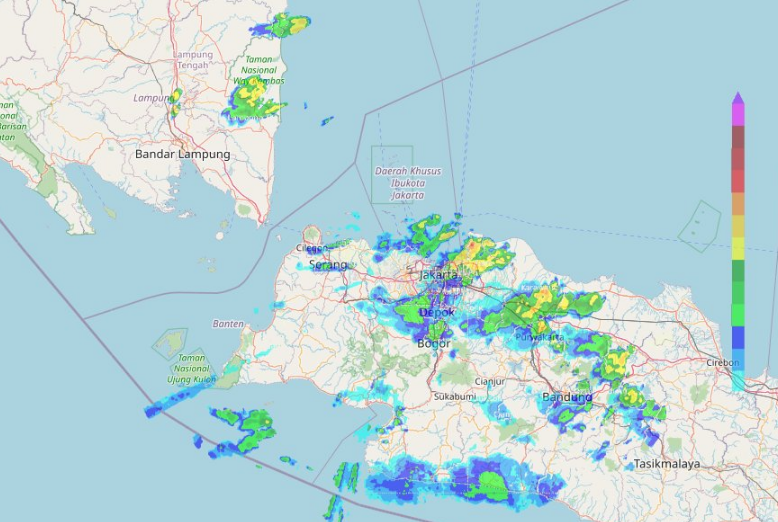
Done
And.. Finished..
But my adventure doesn’t end here…
The next day, after finishing this app, I attended a field event with my local community. To test the accuracy of this forecast system, I frequently used this app to predict whether the event location was going to rain or not. After conducting some direct observations, I came to a conclusion: there are other forecast models that are generally more accurate than this one. One of them is probably cmax(z).
Well, i’m not really sure whether this is a “forecast model” to predict the future, or simply a “data model” to describe the current sky’s situation. I’m not a professional meteorologist, but I consulted with my meteorologist friend on X (formerly Twitter) about this. He said “cmax” means column maximum, the maximum rain intensity around an atmosphere’s vertical column, measured in dbZ unit. So, roughly, it describes the current situation: which place is raining right now, and how intense it is.
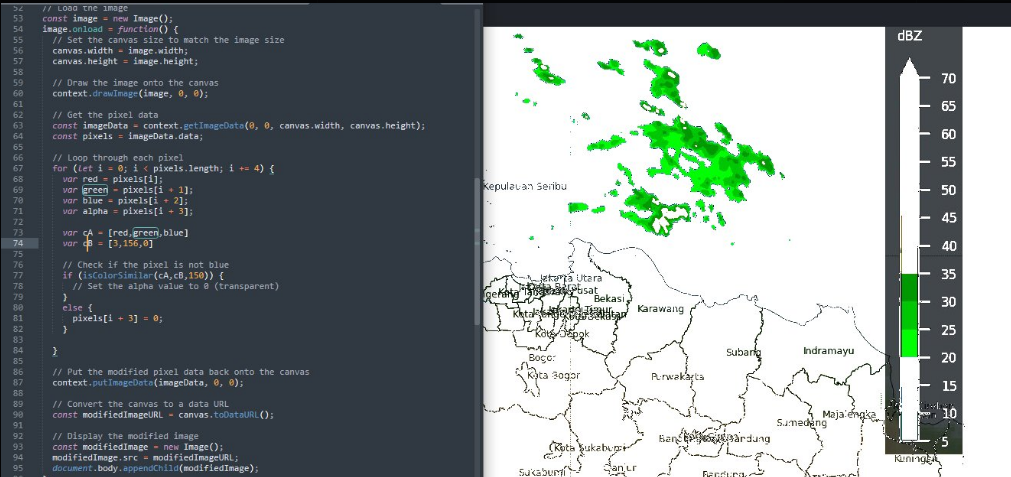
Alright. So, what’s next? Just do the exact procedure as before, but use a different image overlay? No, no, no. This one is different. Instead of simply overlaying the whole image, I have to manually “select” each color code and delete every other color that exists on the image.
Thankfully, we’re able to do pixel-by-pixel manipulation using the Canvas API.
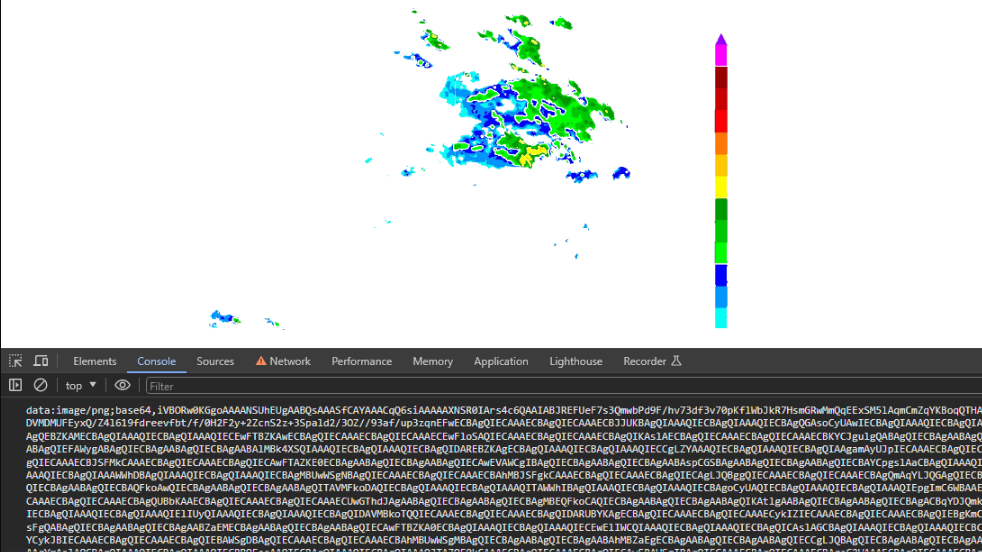
And it’s done.
You can check the source code here.
Epilogue
Apparently, because I made too many requests to the weather station’s server, at some point, my IP address was blocked.
At first, I was planning to release this app publicly so that anyone could see the current weather conditions around a specific coordinate in real-time. But knowing that the weather station’s server is very sensitive to surges in traffic, I had to postpone this plan. The app was deployed to my own phone instead, and I used it for my personal use only.
Well, maybe I should talk to the weather station’s authorities before releasing this app publicly.